| | import numpy
import math
import scipy
import matplotlib.pyplot as plt
dt = 0.05
real_t = numpy.array( [0., 1., 2., 2.+dt, 3.+dt, 4.+dt] )
assumed_t = numpy.array( [0., 1., 2., 3., 4., 5.] )
x = numpy.sin( real_t )
y = numpy.cos( real_t )
S=[0]
for i in range(1,len(x)):
ds=math.hypot(x[i-1]-x[i],y[i-1]-y[i])
S.append(S[i-1]+ds)
assumed_t = numpy.array( S )
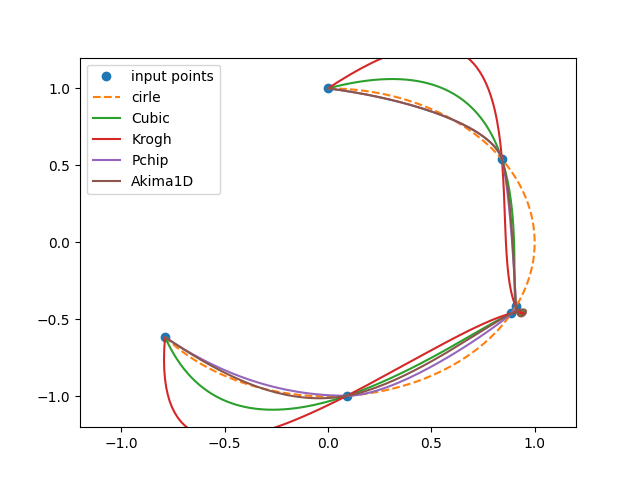
plt.plot(x, y, 'o', label='input points')
plt.plot(numpy.sin( numpy.linspace( 0., 4.+dt, 100 ) ),
numpy.cos( numpy.linspace( 0., 4.+dt, 100 ) ), '--', label='cirle')
t_test_plonts = numpy.linspace( min(assumed_t), max(assumed_t), 200 )
t_p_plonts = numpy.linspace( min(assumed_t), max(assumed_t), 8 )
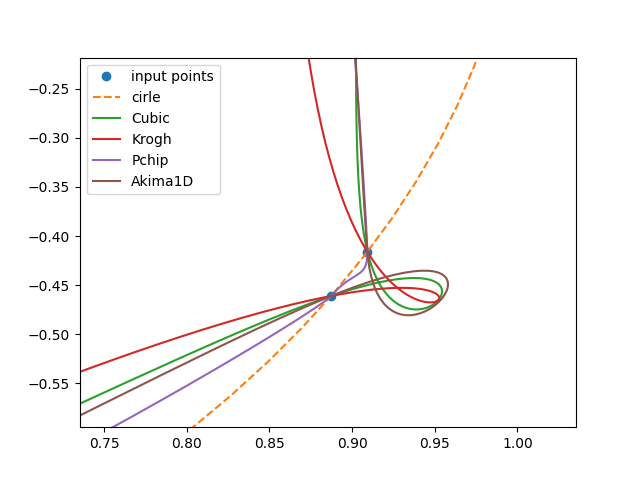
for alg, name in zip([scipy.interpolate.CubicSpline, scipy.interpolate.KroghInterpolator,
scipy.interpolate.PchipInterpolator, scipy.interpolate.Akima1DInterpolator],
["Cubic", "Krogh", "Pchip", "Akima1D"]):
x_spline = alg(assumed_t, x)(t_test_plonts)
y_spline = alg(assumed_t, y)(t_test_plonts)
plt.plot(x_spline, y_spline, '-', label=name)
for alg, name in zip([scipy.interpolate.CubicSpline],
["nCubic"]):
fx=alg(assumed_t, x)
fy=alg(assumed_t, y)
x0 = fx(t_p_plonts)
y0 = fy(t_p_plonts)
xdot = fx.derivative(1)(t_p_plonts)
ydot = fy.derivative(1)(t_p_plonts)
for k in range(len(x0)):
dl=numpy.array([xdot[k],ydot[k]])
dl=dl/numpy.linalg.norm(dl)
dn=numpy.array([dl[1],-dl[0]])*0.1
px=[ x0[k]-dn[0] , x0[k]+dn[0] ]
py=[ y0[k]-dn[1] , y0[k]+dn[1] ]
name_k="%s%d"%(name,k)
plt.plot(px,py,'-')
plt.xlim([-1.2, 1.2])
plt.ylim([-1.2, 1.2])
plt.legend()
plt.gca().set_aspect('equal', adjustable='box')
plt.show()
|